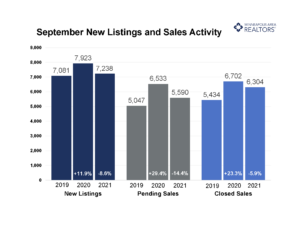
(October 19, 2021) – According to new data from Minneapolis Area REALTORS® and the Saint Paul Area Association of REALTORS®, buyers closed on 16.0 percent more homes in the Twin Cities metro area last month compared to September 2019. Sales were down 5.9 percent, however, from the heightened pace of September 2020. The trend still indicates rising demand, and suggests that much of last year was an outlier and unsustainable.
Both seller and buyer activity were down from 2020 but up from 2019. While the number of signed purchase agreements fell 14.4 percent compared to September 2020, the two-year growth from 5,047 purchase contracts in 2019 represents a 10.8 percent gain. That amounts to about 5.4 percent demand growth per year, a stable and healthy rate. Buyers remain active and persistent, though perhaps a bit more cautious. But because much of 2020 and 2021 are not apples-to-apples, year-over-year comparisons will continue to be distorted.
“We are still in a period where year-over-year comparisons can be skewed,” said Todd Walker, President of Minneapolis Area REALTORS®. “We’ve gone from March 3 to March 1—still a fast pace, but agents are seeing fewer multiple offers. Bypassed inspections and appraisal gap clauses are also less prevalent.” The metro area remains a firm seller’s market with just 1.5 months supply of inventory. That’s the lowest figure for any September going back two decades. Historically, five to six months of supply is considered a balanced market that doesn’t favor one side or the other—buyer or seller.
Seller activity declined 8.6 percent over the last year but rose slightly over the last two years. This is the region’s third consecutive year of September new listings exceeding 7,000, which hasn’t happened since 2007-2009. The median sales price for the metro rallied 10.2 percent from last year to $341,750. That’s shy of the $350,000 record high that held steady in June, July and August of this year. “While pricing remains firm, we’re at a time of year where activity typically slows down for the season,” according to Tracy Baglio, President of the Saint Paul Area Association of REALTORS®. “Even though we don’t quite see as fiercely competitive a market as last year or earlier this year, that doesn’t mean buyers suddenly have an upper hand, especially while sellers are still accepting offers over their list price and in record time.”
Activity varies by area, price point and property type. Home sales in Farmington rose 65.9 percent and in Golden Valley by 34.3 percent. Sales in Lino Lakes and Buffalo fell 51.7 percent and 48.3 percent respectively. Signed single family contracts fell 17.5 percent while condo agreements rose 10.4 percent. Sales of homes priced below $200,000 declined 33.6 percent while sales between $400,000 and $600,000 increased 22.2 percent compared to last year. Luxury home sales over $1M increased 7.0 percent from last September but are up 71.6 percent year-to-date.
September 2021 by the numbers compared to a year ago
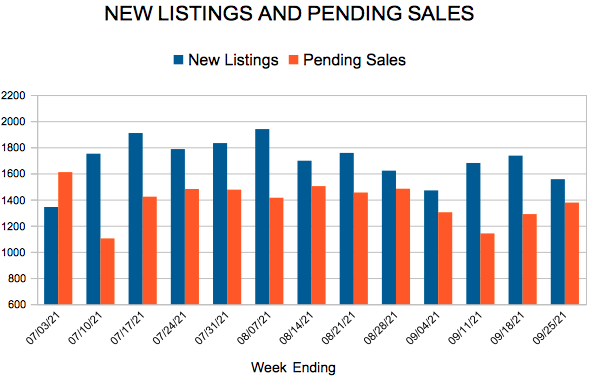
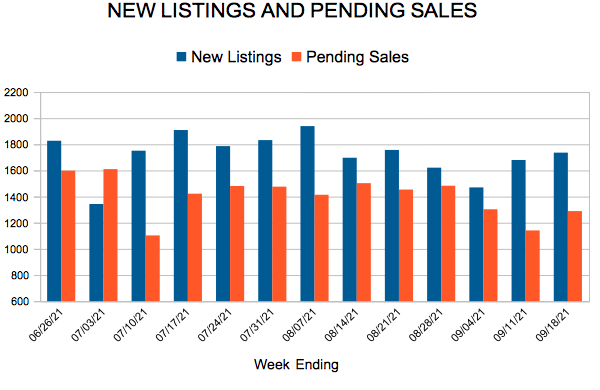
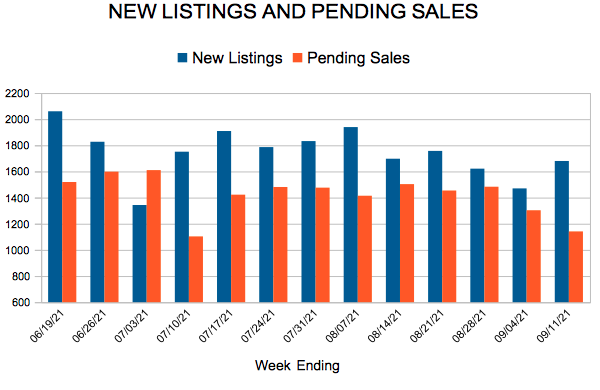
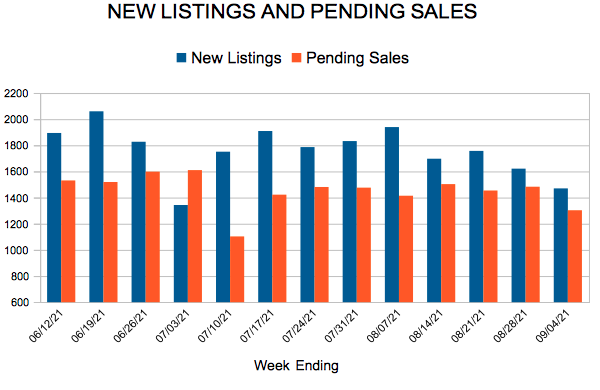
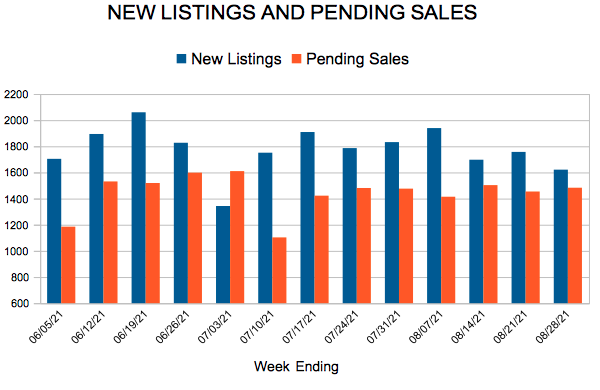
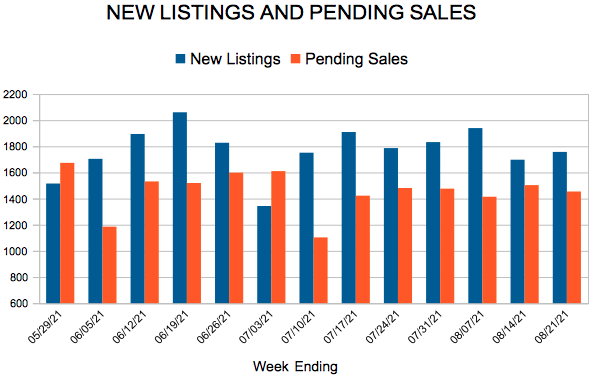
- Sellers listed 7,238 properties on the market, an 8.6 percent decrease from last September
- Buyers signed 5,590 purchase agreements, down 14.4 percent (6,304 closed sales, down 5.9 percent)
- Inventory levels fell 15.6 percent to 8,306 units
- Month’s Supply of Inventory was down 21.1 percent to 1.5 months (4-6 months is balanced)
- The Median Sales Price rose 10.2 percent to $341,750
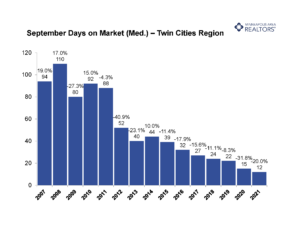
- Days on Market decreased 37.8 percent to 23 days, on average (median of 12 days, down 20.0 percent)
- Changes in Sales activity varied by market segment
- Condo & townhome sales fell 2.0 percent and 2.3 percent respectively, while single family home sales fell 6.0 percent
- Traditional sales were down 4.8 percent; foreclosure sales were down 60.9 percent; short sales fell 66.7 percent
- Previously owned sales dropped 4.2 percent; new construction sales decreased by 14.4 percent